A snap shot of the TransLog menus and setups |
Powertek |
return to TransLog | info@powertekuk.com | contact
us
The
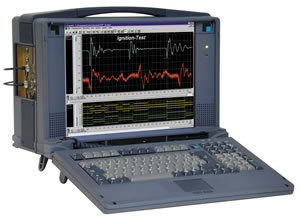
TransLog can be utilised as a sophisticated transient recorder, digital storage
oscilloscope, paperless data recorder or spectrum analyser. Put it to use where
multiple events require high accuracy, long memory and high resolution recording.
Clearly, a highly flexible measurement system with potentially high channel count requires an appropriate method of setting up the hardware. Utilising virtual knobs and sliders would soon overcrowd even the best high resolution displays. TransLog utilises a control panel to assist in hardware setup. A highly visible combination of set up masks and drop down lists, display channel setup parameters. |
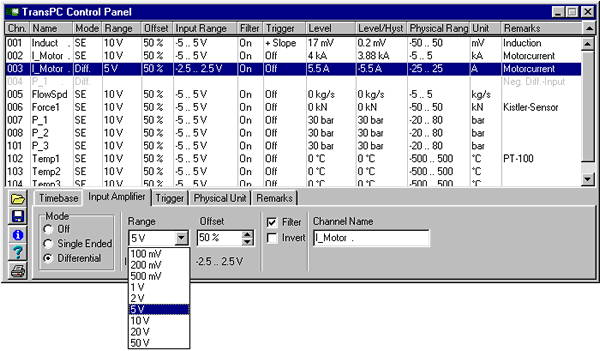
One or several channels can be marked, the marked areas indicate which channels are enabled for set up using the mask in the lower part of the display. The masks are in the form of several "card files" used for setting up time base, input amplifier (range, offset, filter, etc.), trigger (slope, window, level, pre trigger, etc.), and scaling of physical units. In addition, a free text input field is available for user notes etc. on each channel. |
| Macro Programming |
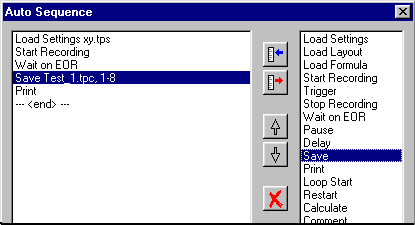
| In many applications an automation of the data acquisition sequence is required (e.g. operator free event and failure registration). TransLog solves this problem with an auto sequencing function. A command sequence can be created using a simple set of macro-commands, requiring no specialist programming abilities. Another advantage of macro programming is to create short cuts for repeatedly used sequences in one keystroke e.g. measure, save, then print out etc. Experienced programmers can use the "call" command to incorporate their own programs in the macro sequence. For example you could send an SMS message, or a command to start/stop a machine. |
| No need to program, simply install and start measuring |
Up to now, multi-channel complex data acquisition tasks required a time consuming process to configure or program the hardware. Further work was required to produce the results in a satisfactory format. Through a combination of practical experience, and the strict application of the Microsoft Windows standards, the TransLog program offers the flexibility in hardware control that can be applied to a universal range of applications, coupled with highly visible easy to use control functions. |
| Laying out
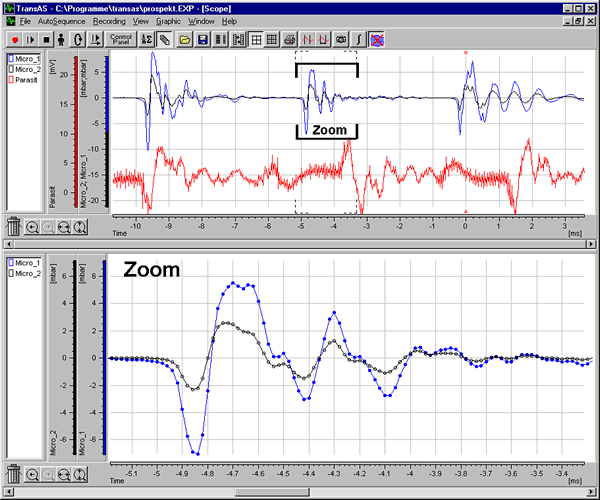
the optimal graphics using setup masks can often be a time consuming business. TransLog elegantly solves this problem using "Drag & Drop" techniques in addition to mouse-symbol related floating menus. Simply place the mouse cursor over a relevant part of the graphics, where the pointer symbol will change to perform zooming, scrolling, panning of individual traces, text and readout-cursors placements etc. Readout tables and plot displays can be laid out using the mouse to move the data from one to the other. Undo/Redo function over several steps are available for zooming and scrolling. |
| An Unlimited Variety of Layouts |
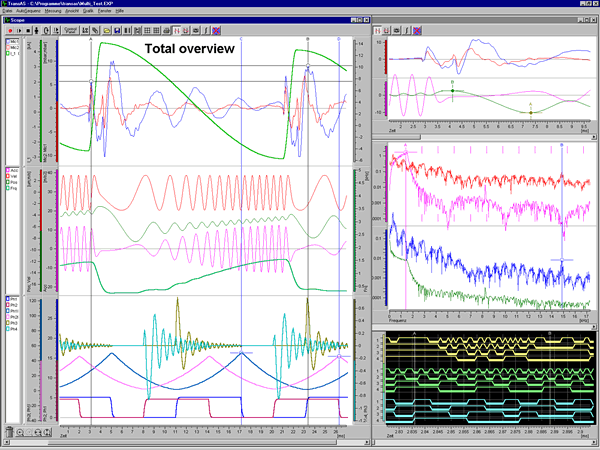
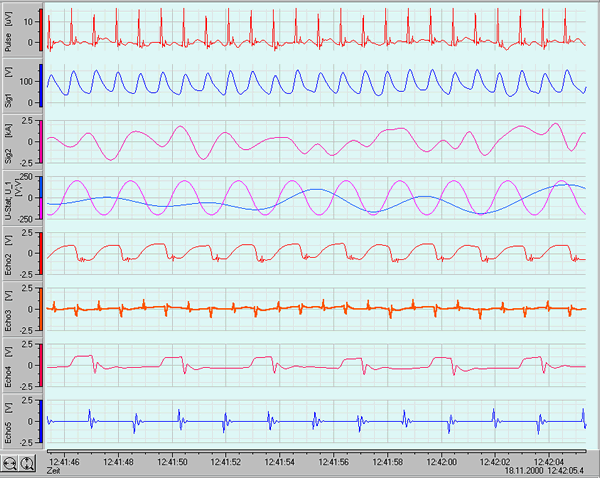
The increased screen resolution available in today’s PC’s allows for a large number of plots and data to be displayed simultaneously. TransLog has the power to display practically an unlimited number of traces in many different windows. This feature is usable not only in post-processing, but also during data acquisition. Measurements in scope-mode, as well as spectrum and mathematically calculated curves are all continuously updated. |
| A Direct Way to Analyse |
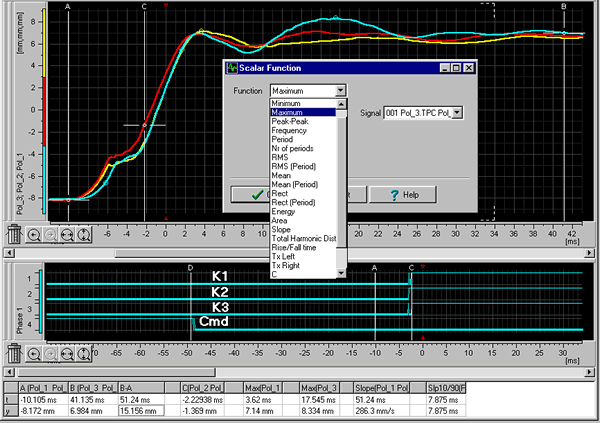
Signal scaling, labelling and grids are automatically optimised to match the selected portion of the signal trace. Two main, and up to 24 additional cursors are available for direct and detailed signal analysis. Calculating scalar functions (single values such as minimum, average, slope, etc.) can be achieved by placing cursors in the relevant portion of the signal trace. Several values can be simultaneously calculated from one or more traces and displayed in tabular form. |
| Multi-Block |
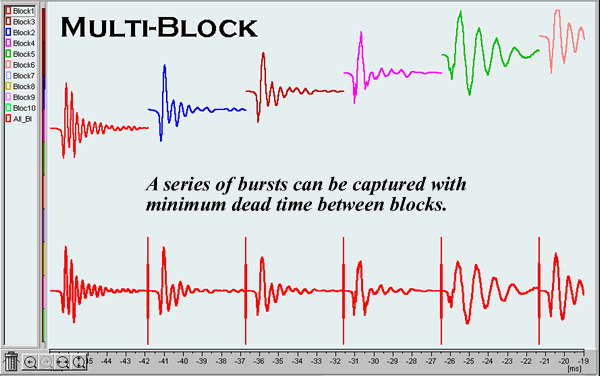
Each measurement channel has it’s own physical memory. Depending on the number of configured channels, up to 16 million values can be captured and stored. The memory may be segmented in block form for short period acquisitions. If a series of transients are to be captured, then the Multi-Block Mode is utilised to store them sequentially in consecutive blocks. |
| Curve Calculation? Write a Formula |
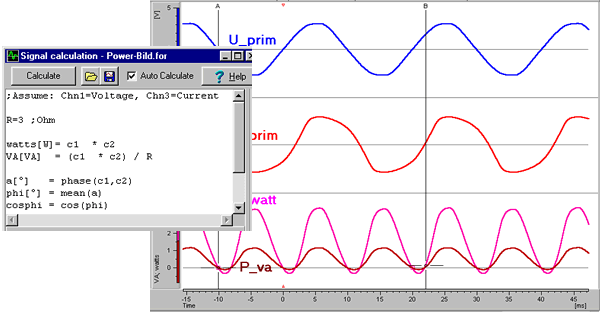
A formula editor is available that makes trace calculations easy. Defined functions can be initiated in manual or automatic mode. |
| Synchronous Time Averaging |
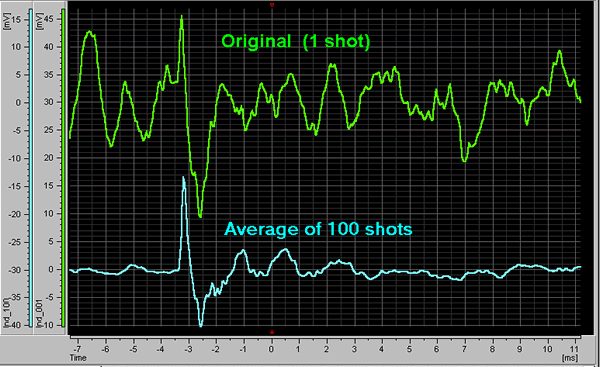
Averaging a signal over several triggered captures increases the signal to noise ratio making the desired signal more apparent. |
| X-Y Display |
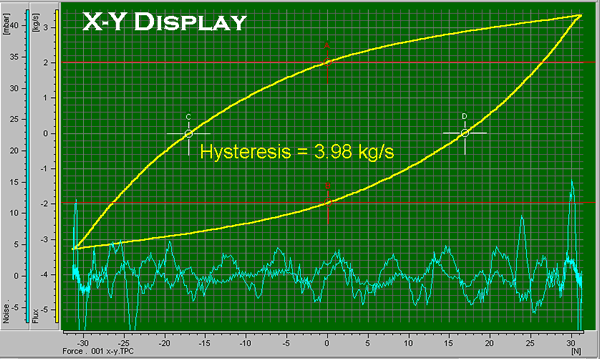
As in all TransLog graphic features, X-Y-display allows for several traces in several windows to be presented. |
| Single Transient or Oscilloscope |
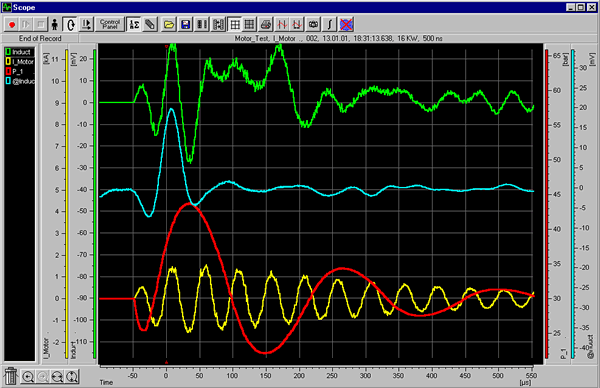
Single transients or repeated events are both displayed in scope mode. The captured signals are stored in the TransLog modules independent of the PC memory, and can be displayed directly after capture. Continuous signals are displayed flicker free, due to high speed data processing. Refresh rates of less than 50ms are easily achieved when using a Pentium III processor. |
| Long Storage but still Fast : Direct to Hard Disk |
A finite capture time can be set, or the recorder can be allowed to run up to the limit of the hard disk space. This stored data is displayed in the normal way using TransLog analysing function. Such measurements normally involve a large amount of measurement samplings. The unlimited zoom and scroll functions make plot manipulation easy. Envelope display mode enables short transient events which occur during a long data capture to be highlighted. |
| Fast Capture on Slow Signals |
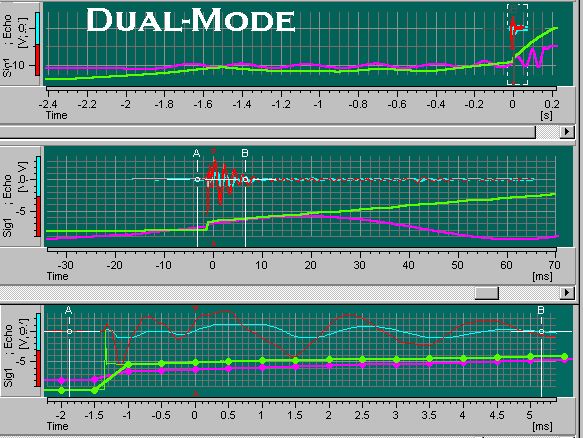
Unique to TransLog is the ability to combine high speed sampling (up to the range of several MHz) simultaneously with slow speed background signal recording. In this Dual-Mode the hardware operates as high speed transient recorder with its own physical memory. During this process TransLog is capturing and transferring data to hard disk at a slower rate. |
| Frequency Analysis up to 20MHz |
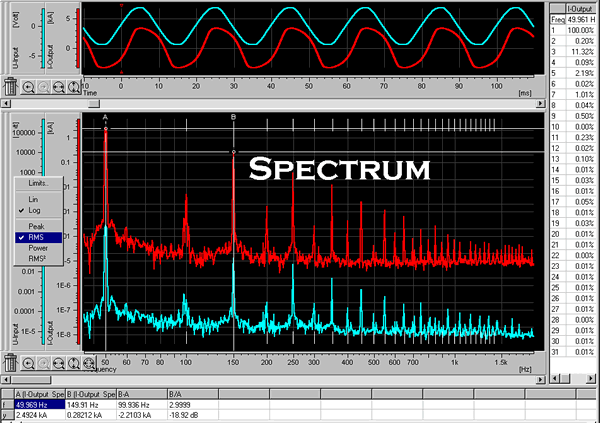
Sometimes it is necessary to convert time signals into the frequency domain. TransLog performs this task using a fast Discrete Fourier Transform.The advantage of this method is that there are no restrictions on the number of samples acquired. This means that the number of time points must not be organised in a factor of two and can be a block of many millions of samples. Up to 99 harmonics can be identified and listed. |
